I once walked onto a mixed-use residential conversion site where the property developer was on the verge of facing a massive work-stoppage order. The local municipality had received dozens of noise complaints regarding an industrial HVAC chiller unit running on the roof. The developer insisted the unit was “pretty quiet,” relying on a free smartphone decibel app that claimed the noise was peaking at a comfortable 55 dBA.
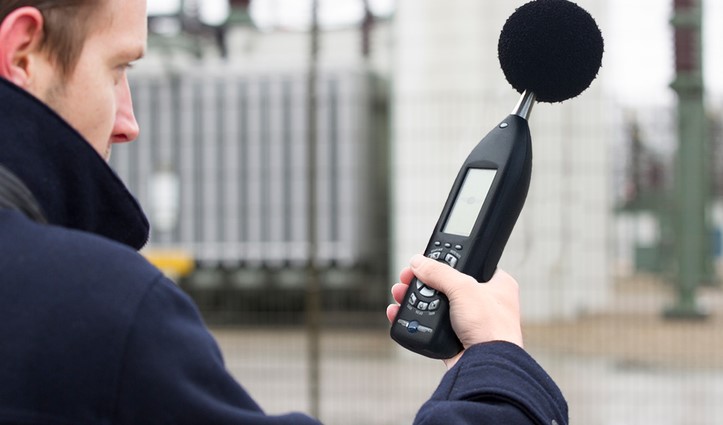
I pulled out my calibrated Class 1 sound level meter, fitted with a wind screen, and took a series of standardized equivalent continuous sound level measurements along the property boundary line. The real data told a completely different story: low-frequency rumble and structural vibration peaks were pushing the true acoustic energy past 72 dBC, blowing right past local noise ordinances.
A $50,000 regulatory fine and a costly retrofit were avoided only because we caught the exact frequency profile early and installed targeted acoustic isolation dampers. In my more than ten years of hands-on home improvement, structural acoustic retrofitting, and job-site compliance management, I’ve learned one universal truth: human ears adapt to noise, and consumer phone apps guess, but an industry-grade decibel meter never lies.
The Physics of Sound Measurement: Decibels, Pressure, and Human Hearing
To understand why simple decibel readings can be deceiving, you first have to understand how acoustic energy moves through space and how our ears register it. Sound is nothing more than micro-variations in atmospheric pressure traveling as acoustic waves.
Think of an industrial sound source like a stone dropped into a calm pond. The ripples spreading across the water represent pressure waves pushing against air molecules. A high-grade sound level meter acts like an ultra-sensitive electronic membrane that measures the exact displacement height of those waves, converting rapid air pressure changes into standardized logarithmic pressure levels known as decibels (dB).
       ACOUSTIC WAVE PRESSURE                     MEASUREMENT CONVERSION MATRIX
   (Air Micro-Pressure Fluctuations)          (Precision Microphone & Frequency Filter)

     +-----------------------+                  +-----------------------+
     | HVAC / Power Tool     |                  | Precision Condenser   |
  ===> [Pressure Oscillations]<===            ===> [Microphone Capsule  ] <===
     | Sound Source          |                  | (Converts to Voltage) |
     +-----------------------+                  +-----------------------+
                 |                                          |
                 v                                          v
       Acoustic Wave Energy                     Frequency Weighting (A/C)
                                                            |
                                                            v
                                                   Calibrated dB Reading
Logarithmic Scaling: The 3 dB Rule
Sound pressure levels are measured on a logarithmic scale rather than a linear one. This means that a sound measuring 70 dB is not merely 10% louder than a 60 dB sound—it actually carries ten times more sound energy.
In practical field analysis, every increase of 3 dB represents a doubling of sound energy. If a workshop air compressor emits 80 dB and you turn on a second identical compressor next to it, the combined sound level isn’t 160 dB; it’s 83 dB. Understanding this mathematical compression is critical when designing sound barriers or evaluating workplace safety compliance under OSHA standards.
Frequency Weighting Networks: A-Weighting vs. C-Weighting
A professional acoustic meter allows you to filter sound frequencies using standardized weighting curves. Selecting the wrong frequency filter will completely invalidate your environmental compliance data.
+--------------------------------------------------------------------------+
|                     FREQUENCY WEIGHTING COMPARISON                       |
|                                                                          |
|   +---------------------------------+  +------------------------------+  |
|   |       A-WEIGHTING (dBA)         |  |       C-WEIGHTING (dBC)      |  |
|   |  * Mimics human ear hearing     |  |  * Near-flat frequency response| |
|   |  * Cuts low & ultra-high pitch  |  |  * Captures deep bass rumble |  |
|   |  * Required for OSHA compliance |  |  * Ideal for HVAC & machinery |  |
|   +---------------------------------+  +------------------------------+  |
+--------------------------------------------------------------------------+
1. A-Weighting Curve (dBA)
The human ear does not hear all frequencies equally; it is naturally insensitive to very low bass frequencies and extremely high pitches. The A-weighting filter de-emphasizes low frequencies to match the human ear’s response curve at moderate volume levels.
-
Best For: Workplace safety audits, ambient residential noise monitoring, and standard OSHA hearing conservation compliance.
2. C-Weighting Curve (dBC)
The C-weighting curve provides a nearly flat response across the entire acoustic spectrum, retaining all the low-frequency bass energy that human ears feel as vibration rather than pure pitch.
-
Best For: Industrial machinery analysis, sub-woofer impact testing, HVAC compressor noise isolation, and structural acoustic troubleshooting.
Technical Instrument Classification: Class 1 vs. Class 2 Meters
Selecting the correct instrument precision class depends on whether your data needs to hold up in court or serve as a routine job-site sanity check.
| Specification Parameter | Class 1 Sound Level Meter | Class 2 Sound Level Meter | Smartphone Consumer Apps |
| Tolerance Margin (At 1 kHz) | $\pm 0.7\text{ dB}$ | $\pm 1.4\text{ dB}$ | Up to $\pm 8.0\text{ dB}$ (Uncalibrated) |
| Frequency Bandwidth Range | $10\text{ Hz}$ to $20\text{ kHz}$ | $20\text{ Hz}$ to $8\text{ kHz}$ | Limited by Phone Mic Capsule |
| Legal / Regulatory Standing | Court-Admissible Compliance Data | General Industrial & Field Audits | Not Admissible for Compliance |
| Primary Field Application | Precision Acoustic Engineering | Job-Site Noise Level Audits | Casual Reference Only |
Pro Tip: Never submit smartphone app readings to a local municipal board or OSHA inspector during a noise dispute. Phone microphones are optimized to compress human speech, meaning they clip high-volume peaks and ignore low-frequency rumble below $100\text{ Hz}$.
Operational Protocol: Field Calibration and Environmental Control
To ensure your acoustic monitoring data is reliable and repeatable, follow this step-by-step field measurement workflow:
+--------------------------------------------------------------------------+
|                     5-STAGE ACOUSTIC MEASUREMENT FLOW                    |
|                                                                          |
|   +-------------------+      +-------------------+      +------------+   |
|   | 1. Field Calibrator| --->| 2. Fit Windscreen | ---> | 3. Set     |   |
|   |    Check (94 dB)  |      |    Dome Shield    |      |    Response|   |
|   +-------------------+      +-------------------+      |    (Fast/  |   |
|                                                         |    Slow)   |   |
|                                                         +------------+   |
|                                                                |         |
|                                                                v         |
|                              +-------------------+      +------------+   |
|                              | 5. Log Continuous | <--- | 4. Tripod  |   |
|                              |    $L_{eq}$ Metrics|      |    Mounting|   |
|                              +-------------------+      +------------+   |
+--------------------------------------------------------------------------+
Step 1: Pre-Measurement Field Calibration
Before taking any official readings, seat an acoustic field calibrator over your meter’s condenser microphone. The calibrator emits a precise $1\text{ kHz}$ sine wave at exactly $94.0\text{ dB}$ (or $114.0\text{ dB}$). Adjust your meter’s internal calibration trim until the digital display reads $94.0\text{ dB}$ precisely.
Step 2: Atmospheric Shielding
Always slip an open-cell foam windscreen over the microphone capsule when working outdoors or near HVAC air currents. Wind blowing across an exposed microphone diaphragm creates turbulence, artificially boosting low-frequency noise readings by as much as $10\text{ dB}$ to $15\text{ dB}$.
Step 3: Tripod Isolation and Mounting
Never hand-hold a sound level meter during compliance testing! Your body acts as an acoustic reflector, bouncing sound waves back into the microphone element. Mount the meter onto a standard tripod at a height of $1.2$ to $1.5\text{ meters}$ above the ground, angled at $45\text{ degrees}$ toward the noise source.
Expert Advice: Hidden Pitfalls to Avoid
Even seasoned facility inspectors can gather corrupted acoustic data if they ignore environmental physics. Keep these critical warnings in mind during your next field audit:
Hidden Pitfall 1: Ignoring Wall Surface Reflections
Standing too close to a hard brick wall, concrete barrier, or glass window while taking decibel readings creates acoustic reflections (boundary effects) that artificially inflate your readings by up to $3\text{ dB}$ to $6\text{ dB}$. Always position your meter at least $1.5\text{ meters}$ away from large reflective vertical surfaces.
Hidden Pitfall 2: Confusing Instantaneous Peak with Equivalent Continuous Sound ($L_{eq}$)
Municipal noise codes rarely focus on a single fraction-of-a-second noise spike. They evaluate the Equivalent Continuous Sound Level ($L_{eq}$)—the average acoustic energy over a specified period (such as 15 minutes or 1 hour). Logging raw instantaneous peaks instead of integrated $L_{eq}$ data will make a compliant facility appear non-compliant.
Master Your Site Acoustics with Confidence
Acoustic management in home improvement and industrial remodeling isn’t about guessing how loud a room feels—it’s about collecting verified, repeatable data. Equipping your site inspection toolkit with a certified sound level meter allows you to resolve municipal noise disputes, engineer effective soundproofing assemblies, and protect worker hearing with precision.
Take a walk around your job site or property boundary this week. Are your generator pads, workshop tools, or exterior HVAC units running within legal decibel thresholds?
Have you ever dealt with tricky acoustic issues or noise complaints on a project? Drop your questions or site scenarios in the comments below, and let’s analyze your acoustic strategy together!
